What to Look for in a Commercial Real Estate Agent in San Diego (And the Questions Worth Asking)
June 19, 2026
Buying a Strip Mall in California: What the Numbers Look Like Before You Make an Offer
June 21, 2026
The market doesn’t care what you paid in 2016. It cares about what the asset produces, what comparable properties are trading for right now, and what a buyer’s lender will actually underwrite. In a market like San Diego - where industrial vacancy has compressed dramatically, retail is bifurcating between struggling and thriving, and multifamily cap rates have shifted with interest rate pressure - relying on a single data point to set your price is a liability.
The good news is that commercial property valuation isn’t a mystery. There are established methods that appraisers, brokers, and informed buyers use to arrive at value, and understanding them gives sellers a real advantage. The income approach, the sales comparison approach, the cost approach, and the gross rent multiplier each tell a different part of the story - and knowing which one applies to your asset type, and why, can be the difference between a smooth transaction and a deal that dies in due diligence.
What follows is a practical overview of these methods, grounded in how they actually play out across San Diego’s commercial submarkets. It also surfaces the mistakes that cost sellers - not through bad luck, but through avoidable mispricing rooted in outdated assumptions.
Key Takeaways
- Commercial property value is based on current income and market conditions, not what the seller originally paid.
- Cap rate analysis suits stable income-producing properties; GRM works better for smaller multifamily assets with inconsistent expense documentation.
- Understating operating expenses inflates NOI, leading buyers and sellers to reach very different valuations for the same property.
- California’s assessed value reflects roughly 48.85% of market value and should never be used as a pricing benchmark.
- Sellers who price on outdated assumptions lose negotiating leverage and risk deals collapsing during due diligence.
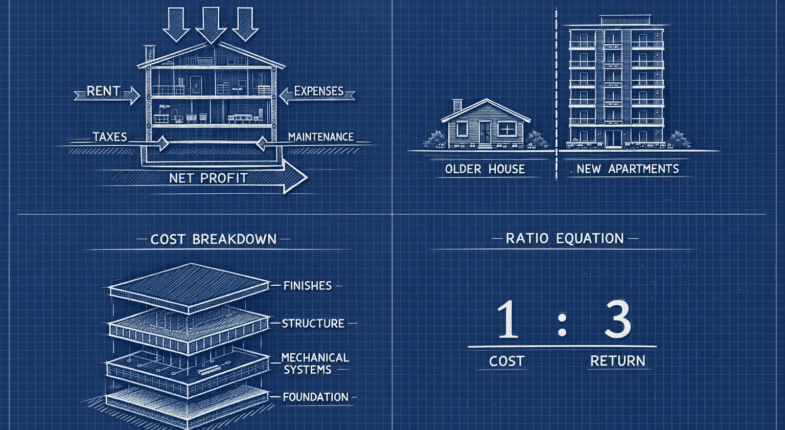
The Four Methods Used to Value Commercial Property in California
There are four ways appraisers and brokers put a number on commercial property, and each one strategies value from a different angle and works way better in some situations than others. Knowing what each one is helps you understand why your property could be priced the way it is.
The income strategy is the one you’ll hear about most in California - it looks at how much income a property generates and works backward to figure out what that income stream is worth to a buyer. For apartment buildings, office space, retail centers, and most other income-making assets, this is the favorite strategy because buyers are primarily purchasing a cash flow - not just a building.
The sales comparison strategy does what the name suggests - it finds similar properties that have sold recently and uses those sale prices as a benchmark. This works for smaller properties or markets with transaction data but gets harder to use when a property is one-of-a-kind or sales volume is low.
The replacement cost strategy estimates what it would cost to build the property from scratch and adjusts for depreciation - it’s more relevant for specialty properties like churches, schools, or buildings that don’t change hands much. In most commercial investment scenarios, it plays a supporting role at best.
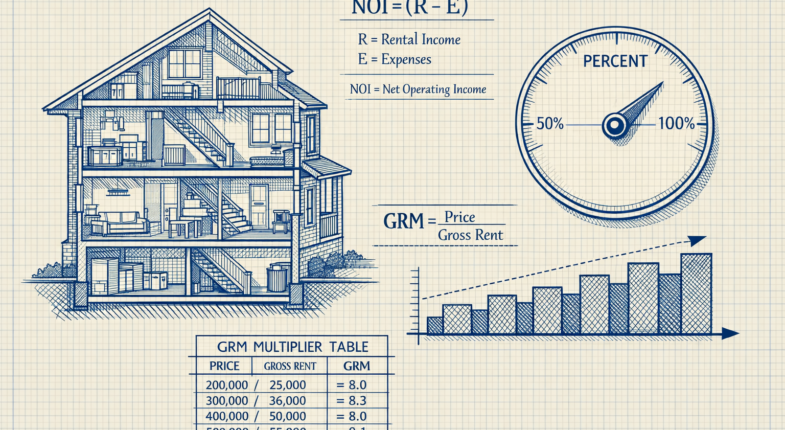
The gross rent multiplier - or GRM - is a variation of income-based thinking, but easy enough to deserve its own mention. It compares a property’s price to its gross rental income as a single multiplier - it’s a fast screening tool rather than a full valuation and works in residential-adjacent markets like small multifamily. More on that in the next section.
One thing worth flagging here: assessed value is not a valuation strategy. California’s State Board of Equalization notes that assessed value sits at roughly 48.85% of market value for properties. Some owners treat their tax assessment as a proxy for what their property is worth, and that leads to some very off-base expectations.
In California’s compressed cap rate environment, the income strategy dominates for most investment property. Buyers are paying close attention to what a building earns and how predictable that income is. The other methods still matter, but learn more about determining fair market value in CRE to understand where the income side of the equation usually starts the conversation.
How Income-Based Valuation and GRM Actually Work in San Diego
Cap rate is the favorite tool for income-producing properties and the math behind it is easy. You take the net operating income - what the property earns after operating costs but before debt - and divide it by the buy price. That gives you the cap rate as a percentage.
San Diego multifamily properties were sitting at a 3.60% cap rate not long ago, which tells you something important about this market. A lower cap rate means buyers are willing to pay more for each dollar of income the property produces. In a city where demand stays high and vacancy stays low, that makes sense.
Why Expense Assumptions Change Everything
The NOI number is only as reliable as the costs behind it. Sellers sometimes present an optimistic income picture by understating costs like property management, maintenance, insurance, and reserves. A buyer who accepts those numbers at face value will calculate a higher NOI and end up overpaying for the asset.
That’s where deals fall apart. Two buyers looking at the same property can walk away with different valuations just because they made different expense assumptions - it pays to be conservative and to verify every line item before you trust the NOI.
GRM: The Faster, Simpler Alternative
Gross rent multiplier works differently - it skips the expense calculation entirely. You divide the sale price by the gross annual rent to get a multiplier, and then you use comparable sales to judge if that number is typical for the area.
GRM is popular for smaller multifamily buildings and mixed-use properties where full financials are hard to nail down - it won’t have the same accuracy as a cap rate analysis. But it gets you in the right ballpark fast. Use it as a first filter instead of a final answer.
What the Cap Rate Trend Signals Right Now
San Diego multifamily cap rates rose about 9% through 2025 and then plateaued at 5.6% in Q1 2026. For buyers, a rising cap rate means prices are softening relative to income, which creates more room to negotiate. For sellers, that same trend means the pricing power they held a few years ago has loosened, and valuations need to adjust to that reality.
Neither side should ignore where cap rates are heading, because the direction matters just as much as the number itself.
When Sales Comparison and Replacement Cost Take the Lead
Income-based valuation works when a property has tenants and a track record. But not every commercial property fits that mold, and that’s where the sales comparison strategy comes in.
Owner-occupied buildings are an example. If a dentist owns the building their practice runs out of, there’s no lease to analyze and no rent roll to reference. The same goes for special-use properties like churches, schools, or medical buildings. For these, appraisers look at what similar properties have sold for and adjust from there.
The challenge in California is that there aren’t as many comparable sales to work with. LA County saw an 18.4% year-over-year decline in commercial sale volume in Q3 2024, and that pattern echoes across the wider Southern California region, like San Diego. Fewer transactions mean thinner data, which makes it harder to draw clean conclusions from comps alone.
Appraisers account for this by widening their search, sometimes pulling sales from neighboring submarkets or going back further in time, and each comp then gets adjusted for differences in size, condition, location, and sale date. It’s a more subjective process than income valuation. But it’s the best tool available when income data doesn’t exist.

Where Replacement Cost Fits In
The cost strategy - estimating what it would cost to build the property from scratch - is used in certain situations. New construction, insurance valuations, and properties with no income and no usable comps are the main ones.
It tends to set a ceiling instead of a precise market value. A buyer won’t pay more than it would cost to build something comparable. But they’ll pay less, and that’s also the case if the market is soft or the property has depreciation baked in.
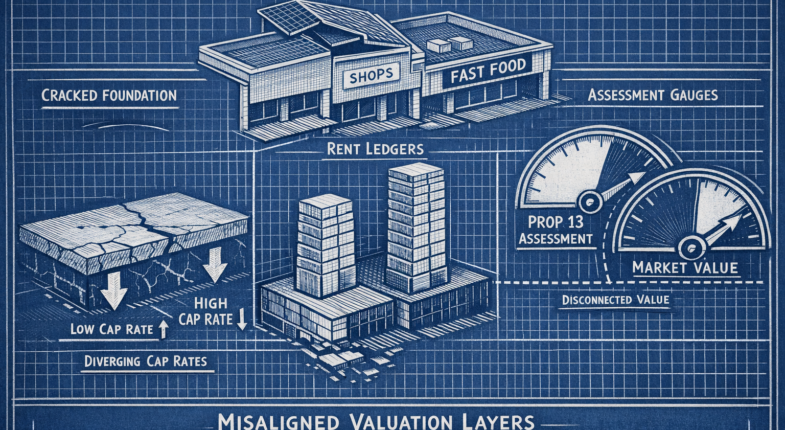
That’s relevant in the office sector. Class A office cap rates in some California markets have pushed above 8%, which signals that investors expect distress or uncertainty ahead. In that environment, replacement cost and market value can be far apart, and relying too heavily on cost-based figures can lead a seller to price a property well above what any buyer will accept.
Each of these methods tells a different part of the story, and understanding which one applies to your property changes how you should think about pricing.
The Seller Mistakes That Lead to Mispricing in California’s Market
One of the most common problems starts with what a seller paid for a property- it’s a natural instinct to use your buy price as a reference point. But buyers don’t care what you paid. They care about what the property earns relative to what they’d be paying.
Take a seller who bought a small retail strip at a 5% cap rate in 2018. That made sense at the time given where interest rates and investor expectations were. But if cap rates in that submarket have since moved to 6.5% or 7%, buyers are going to run the math on latest conditions and come in lower. The property didn’t lose value because something went wrong - the environment changed.
Relying too hard on a single valuation strategy is another problem. A seller might pull a few comparable sales, see a number they like and stop there. But if those comps are two years old or came from a rate environment that no longer applies, they can point you in the wrong direction. California’s commercial market moves unevenly across property types and regions, so a comp from 18 months ago might not offer anything helpful.
Inflated rent projections get sellers into hot water too. Some owners list expected or “market rate” rents as if a buyer will immediately achieve them, instead of showing what the property actually collects. Sophisticated buyers will underwrite to actual income and then discount further for the time and cost to get to those higher rents. The difference between expected and actual can deflate a price pretty quickly once a buyer does the work.
California’s Proposition 13 can add some uncertainty. A property’s assessed value can sit far below its market value after years of capped increases, so some sellers read their tax assessment and walk away with a number that has no connection to what a buyer would pay. The assessed value is a tax calculation- not a market opinion. For context on related tax considerations, it’s worth understanding California’s tax rules on commercial real estate sales.
These are understandable mistakes. Sellers aren’t trying to mislead anyone - they’re working with the information that feels most familiar. But buyers come in with their own models and their own data, and a price built on outdated assumptions or the wrong inputs will slow down or stall a commercial sale fast.
Price It Right the First Time - Here’s How to Think About It
Pricing a commercial property correctly comes down to matching the strategy to the asset, then pressure-testing the result against what the market is actually doing right now. Cap rate analysis fits income-producing properties where net operating income is stable and verifiable. GRM works best for smaller residential-income and light-commercial assets where expense documentation is inconsistent. Blending both alongside a current comp review is what separates a defensible asking price from a guess dressed up in a spreadsheet.
Owners who wait for buyer feedback to discover a pricing problem have already paid for that lesson in time, carrying costs, and negotiating leverage. A professional valuation done before the listing goes live provides the data to price with conviction - and the flexibility to hold your position when the first lowball offer comes in.
With cap rates still compressing and expanding unevenly across asset classes as the market works through post-2025 adjustments, pricing off stale assumptions is a liability no seller can afford. The owners who move well in this environment are the ones who treated current, local data as a prerequisite - not an afterthought.
FAQs
What is a cap rate and why does it matter?
A cap rate is net operating income divided by purchase price, expressed as a percentage. It tells buyers how much return a property generates relative to its cost, making it the primary valuation tool for income-producing commercial properties.
How is GRM different from cap rate analysis?
GRM divides sale price by gross annual rent, skipping expense calculations entirely. It's faster but less precise, making it better suited as a quick screening tool for smaller multifamily properties rather than a definitive valuation method.
Why shouldn't sellers use assessed value for pricing?
California's assessed value reflects roughly 48.85% of market value due to Proposition 13's capped increases. It's a tax calculation, not a market opinion, and using it as a pricing benchmark leads to significantly off-base seller expectations.
What expense mistakes cause commercial valuations to go wrong?
Sellers sometimes understate operating expenses like management fees, maintenance, and reserves to inflate NOI. Buyers will recalculate with realistic costs, arriving at a lower valuation, which often causes deals to collapse during due diligence.
When is the sales comparison approach used over income methods?
Sales comparison is used when a property lacks rental income to analyze, such as owner-occupied buildings or specialty properties like churches and medical facilities. It benchmarks value against recent comparable sales, adjusted for size, condition, and location.